



Your research is worth being visible, comprehended, and referenced in the competitive academic publishing world. Fast Publications is a company that focuses on transforming multifaceted information into captivating stories. We provide the fullest Research Paper Help, we take you through all the lifecycle of the manuscript- drafting, to the final submission. We have a team of subject-matter experts who will make sure that your work is of the most rigorous technical quality and clarity possible. Join Fast Publications and speed up the process of transforming a draft to a high-impact publication.
The Strength of Visual Science: Graphical Abstracting by Examples and Tools
Researchers need to be fast in attracting attention in the age of information overload. The graphical abstract is gradually becoming a mandatory part of modern academic journals besides the text-based summary. This is a visual aide that is a brief but graphical overview of the key findings of your study. Well-designed, it enables readers to perceive the big picture in a single glance.
In case you find it difficult to sum up all the work you have done in one picture, you are not alone. Getting the help of a professional Research Paper is a way to overcome the barrier between complicated data and visualization. This blog will discuss how to use graphical abstracts, and what tools you would use to create them.
The importance of Graphical Abstracts
Efficiency is a concern to editors and readers. A graphical abstract helps to make your research more findable. It makes your work more easily shareable on social media and makes it more visible in search engines. Above all, it makes you find your main point. You might have to sharpen your story when you are not able to envision your outcomes.
Good Graphical Abstracts
Effective graphical abstracts are typically of three types. The selection of the appropriate one will be dependent on your particular study design.
The Process Flow
It is an experimental style or methodology-oriented paper. It utilizes arrows and sequential panels to demonstrate the way you travelled between Point A and Point B. An example is a chemistry paper where the step-by-step reaction of molecules under certain catalysts is demonstrated.
The Comparison Model
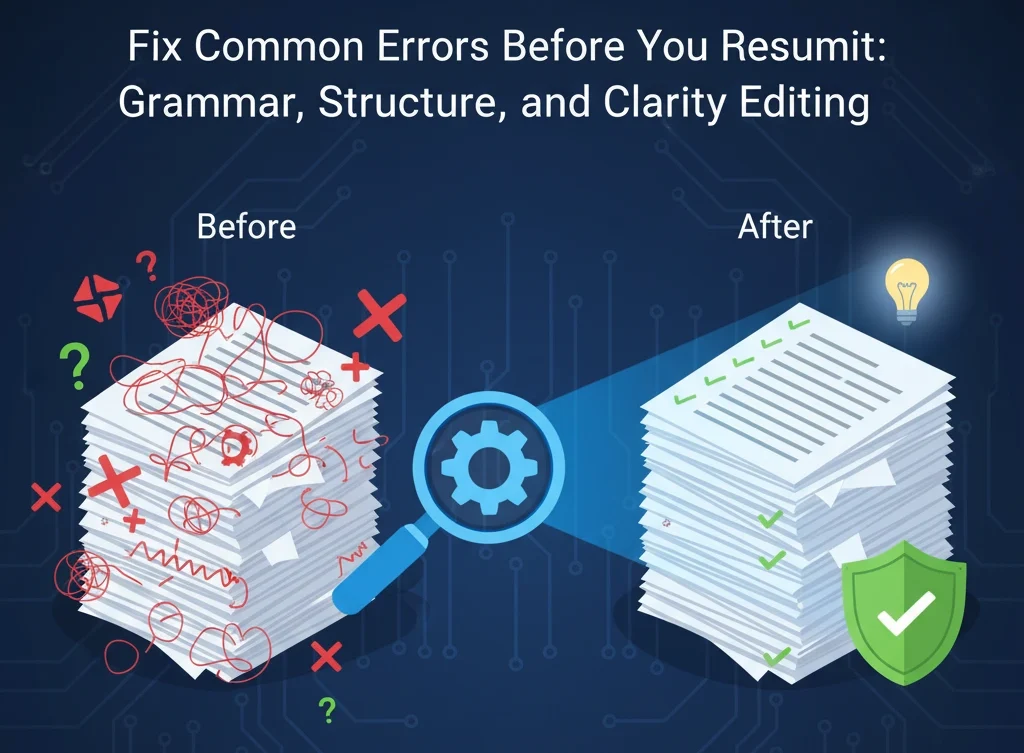
When your study involves comparison of a control group and an experimental group, a Before vs. After or Group A vs. Group B design would be best. This could be used as a medical study to demonstrate the variation between the growth of cells in treated and non-treated samples. It accentuates the effect of your action in the present moment.
Central Concept Map
This model is appropriate when conducting a theoretical or sociological study. It puts the key finding or pillar in the center of the graphic. Themes or contributing factors are those that are related and branch out. This structure enables readers to have an idea of the relationship between various variables without going through the whole results section.

Several Tools that are necessary in the creation of Visuals
To make a professional abstract, you do not have to have a degree in graphic design. There are a number of tools which are specific to the scientific community.
- BioRenderer: It is the gold standard of life sciences. It provides a huge collection of ready-made icons, such as cells, proteins, laboratory equipment. You can make publisher-standard graphics in minutes with it.
- Mind the Graph: This website offers thousands of scientifically-accurate illustrations in a wide range of disciplines, such as physics, social sciences, and engineering. It provides templates that are easy to use and make your layout balanced.
- Canva: Canva is a general design tool, but works well with social science abstracts. Its drag and drop feature and neat font selections allow making concept maps that are aesthetically pleasing.
- Inkscape or Adobe Illustrator: Vector-based software is the way to go in case one wants complete control. These tools enable you to make your own icons which can be resized to any size without compromising quality.
Best Practices of Design
The following are some of the SEO and readability rules to consider when you begin your design:
- Always Be Clarity, Not Art: Do not overload the picture with unnecessary information. Apply contrasting colors to distinguish between various elements.
- Keep a Rational Path: The majority of viewers see pictures either vertically or horizontally. Mark distinct arrows to show their eyes the data.
- Keep Text Minimal: Minimize the use of labels. Allow images to work hard.
- Match Journal Specifications: Each journal contains a certain dimension, font size and file type requirements. Always read the “Instructions for Authors” first.
The role of Professional assistance in the game
Developing a visual summary is a different set of skills than developing a technical paper. Professional Research Paper Help saves time and relieves stress to many researchers. Fast Publications translates your data into quality graphics that can please even the toughest editorial board. We make sure that your graphical abstract is not just a beautiful image, but an effective scientific instrument.
Conclusion
The first impression of your research is a graphical abstract. With the correct tools and guidelines to the known structural examples, you transform a complicated manuscript into a readable narrative. BioRender or Canva: keep in mind that simplicity is your friend.
Are you willing to populate your research? Get the Research Paper Help of the best specialists and allow us to help you see your success with Contact Fast Publications.